Dealership Analytics & AI Dashboards
Analytics & Dashboards
The Matador homepage is AI Wins: a live feed of your AI workforce in action: leads qualified, cold threads reactivated, appointments booked. See what every agent just did, what it's about to touch, and the tasks it created for your team.
 4.8 Momentum Leader · High Performer · Best Est. ROI

















Numbers pulled straight from your CRM and DMS: VinSolutions · CDK Drive · Dealertrack · See all 62 integrations
From Live Feed
to Full Metric Suite
The AI Wins feed
Every agent's activity in real time (what it just did, what it's about to touch) plus the AI-created tasks your team still owes a reply on.
The full metric suite
per-agent performance · appointments influenced
engagement SMS/email split · volume by origin · leads by source · reviews + NPS · video
Per-agent performance, appointments influenced, engagement by channel, message volume by origin, lead sources, review invites and NPS, video metrics: the whole store, measured.
Every appointment, one calendar
Per-user stats (appointments created, messages, reviews, videos) and a calendar view of every appointment, including the ones your AI booked.
Every Number Your Store Runs On
Pulled from the live dashboard: what your AI sent, who engaged, what it booked, and what it banked — by channel, by user, by dollar. A sample of the answers waiting on the other side of the login.
Which channel actually carries your store — and how much of the volume is your AI, not your payroll.
How much of your CRM the AI actually touches — and how much talks back.
Showroom visits traced back to an AI conversation.
Every call priced out — the RO it opened, the deal it advanced, the hour it saved your BDC.
The after-hours shift you never had to staff.
24h 32m of walkarounds actually watched.
Sends, watches, and the exact week video started booking test drives.
Every ring nobody grabbed, answered anyway — and 120,328 text conversations started from them.
Every Rooftop.
One Screen.
Dealership group reporting without logging into 20 stores one by one. Compare agent performance, engagement, sequences, lead sources, users, NPS, and conversation intents across every store, live.
Spot the winners and the sliders
The store trending +20% on AI messages and the one sliding −4.5% on leads, visible in seconds, not spreadsheets. Month-over-month trend lines show who's climbing and who needs a visit.
Replicate the winning playbook
Find the rooftop with the killer credit-app sequence, then push its instructions and frequencies group-wide. Best-practice mining, not best-practice guessing.
Accountability with receipts
Handoff percentage and most-frequent-task views reveal which stores' teams keep up with their AI, and which leave conversations on the floor. Everything exports to PDF, Excel, and CSV for the Monday meeting.
Every Question a GM Asks,
Already Answered
A sample month on the dashboard. No exports, no BDC spreadsheet gymnastics. the numbers your Monday meeting runs on, live.
Straight Answers
What is the AI Wins feed?
Can I see what the AI is about to do, not just what it did?
Do my salespeople see everyone else's numbers?
What does it actually measure?
Does it work across multiple rooftops?
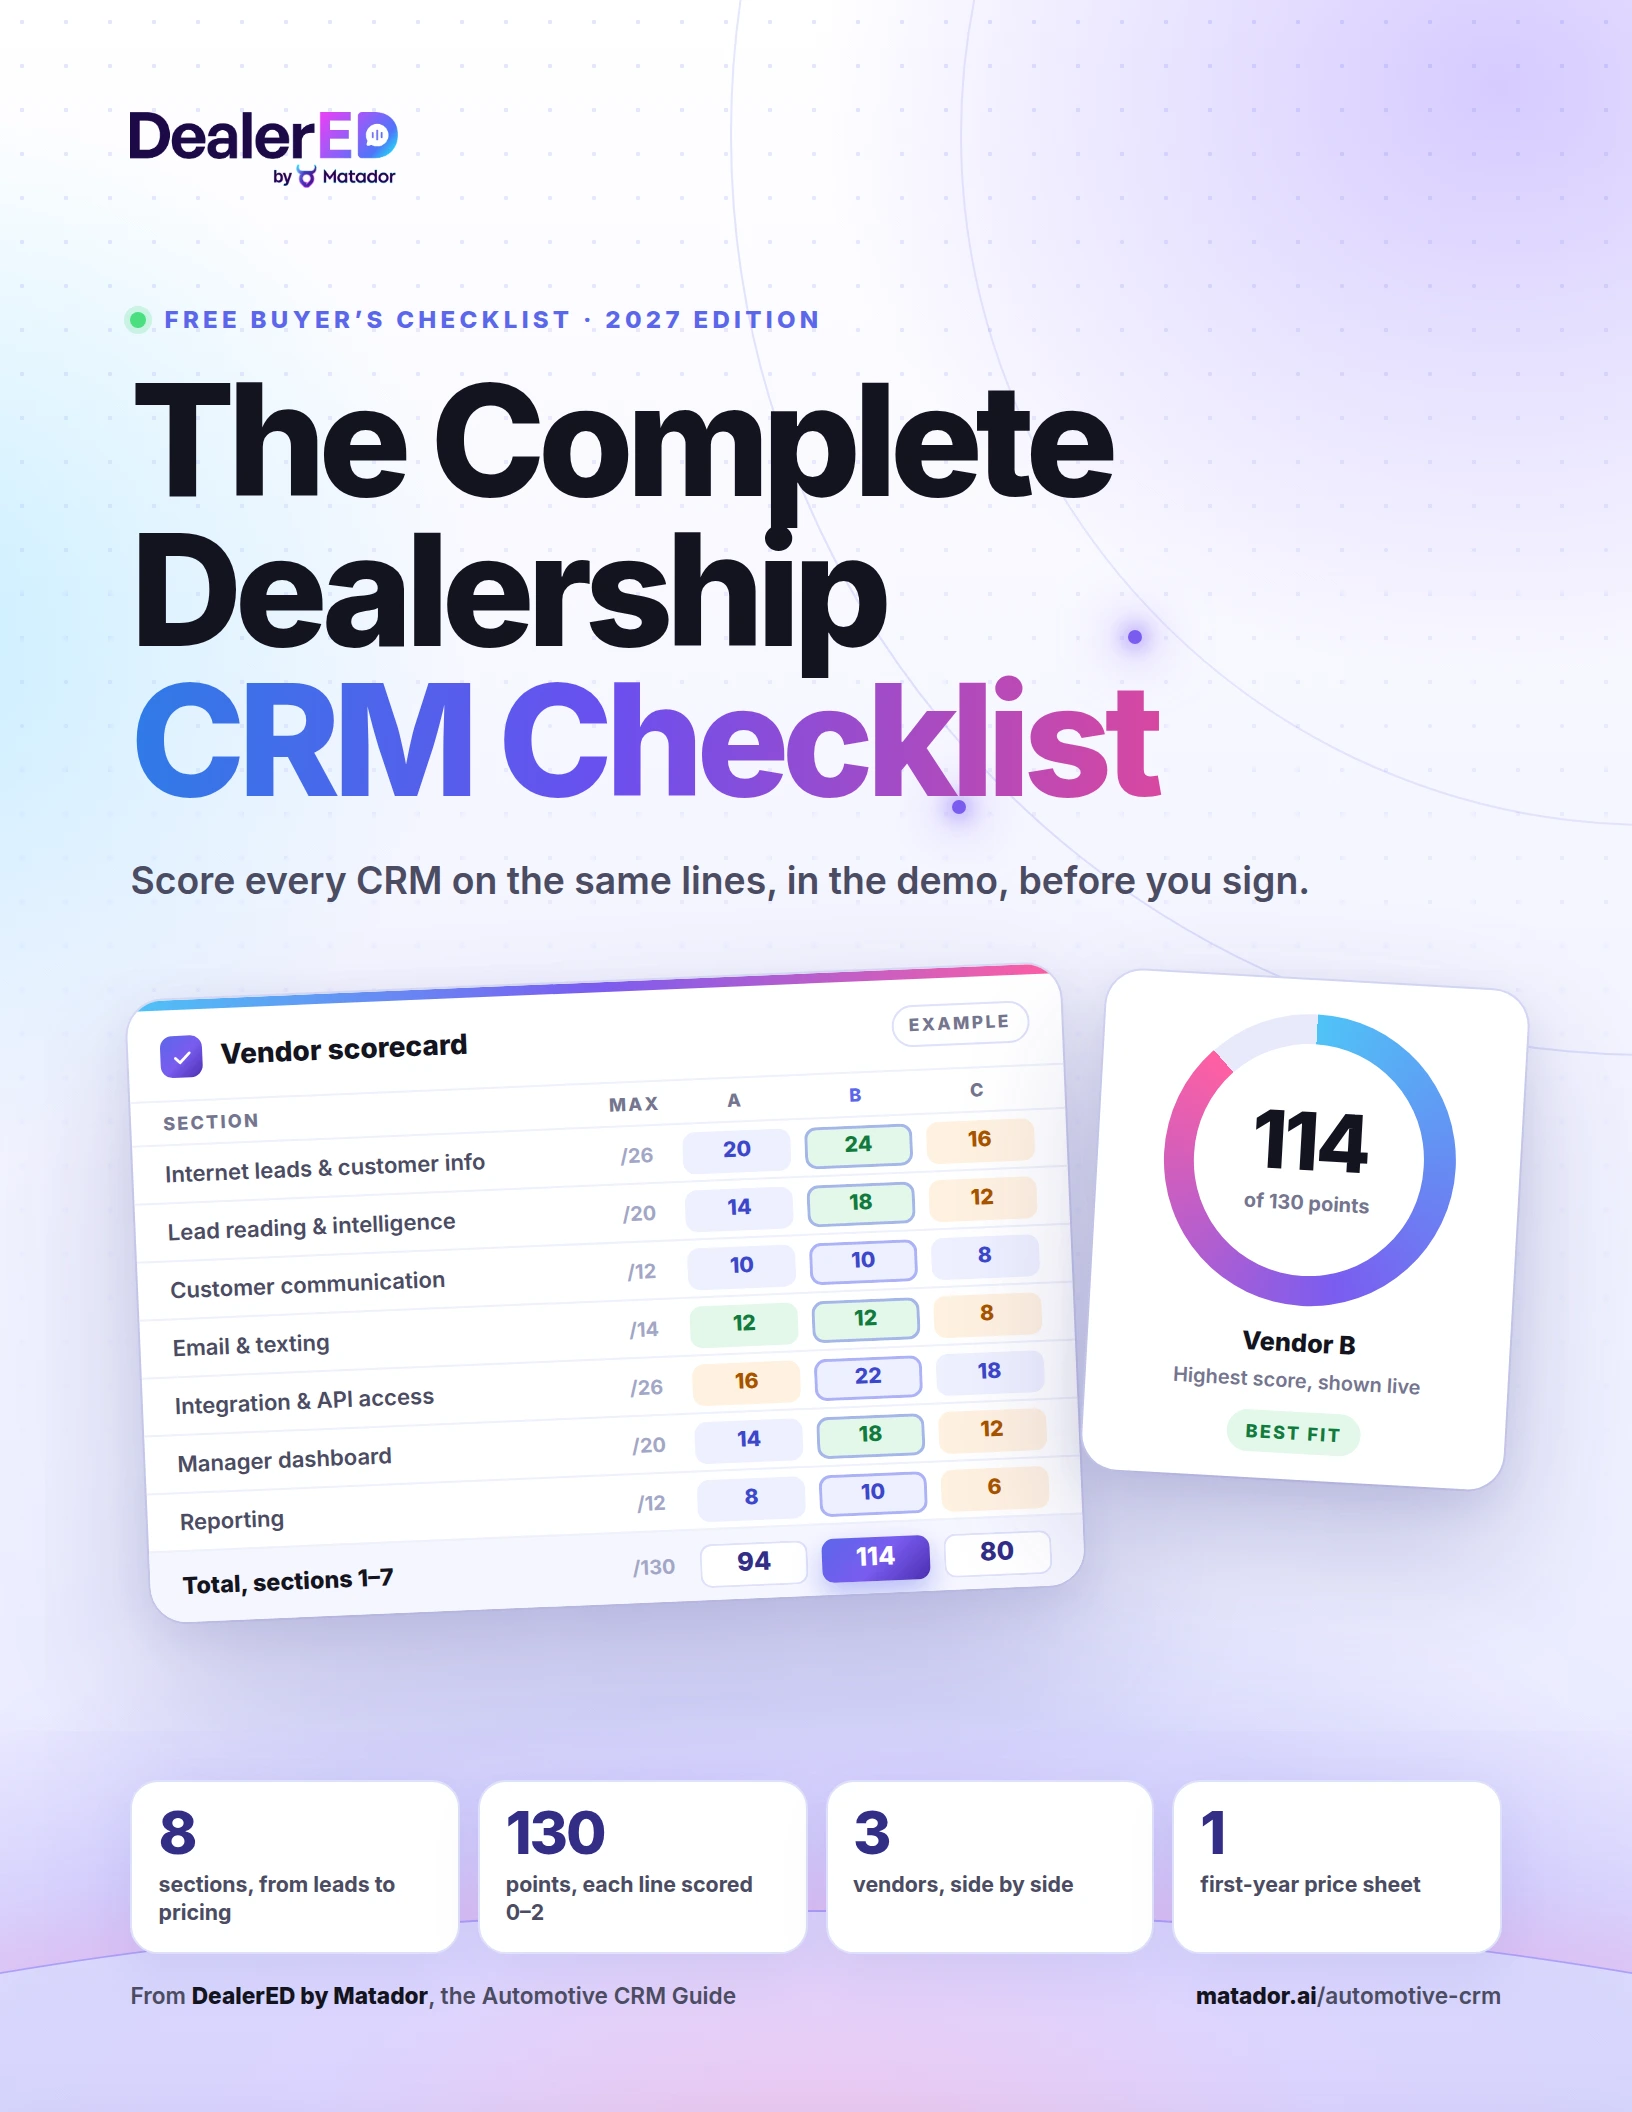
Rethinking Your Automotive CRM?
Score it before you replace it. Our free guide for dealers covers what automotive CRM software must do in 2027, how to score every vendor on the same lines, and when to keep the CRM you have and add AI instead.
Your Whole Store,
One Glance
On the demo, we'll open a live AI Wins feed and the full metric suite, and if you run a group, the enterprise view with every rooftop side by side.